Self-hosted quickstart
Run Flowrensic on your own machine with Docker Compose and connect a Temporal worker.
Get Flowrensic running
This guide is for the self-hosted mode: you run Flowrensic yourself, here on one machine with Docker. If you would rather not run anything, the managed mode (a free, temporary Flowrensic run by us) is coming soon.
The standalone Compose setup starts Flowrensic, Temporal, Prometheus, Grafana, and a demo worker. The demo worker creates sample findings so you can explore the UI immediately.
Create a directory for the Compose file, then copy the YAML below into a file named docker-compose.yml. Use the code block's copy button to copy the full file.
mkdir -p flowrensic-quickstart && cd flowrensic-quickstart# Start the standalone app and its preconfigured local monitoring stack with:
# docker compose -f deploy/standalone/docker-compose.yml up -d
# The demo worker starts workflows that fail, retry, and time out so findings
# appear in Flowrensic without connecting the stack to an external Temporal service.
#
# With the default ports, open these URLs on the Docker host:
# Flowrensic UI: http://127.0.0.1:8080/
# Flowrensic API docs: http://127.0.0.1:8080/docs
# Flowrensic OpenAPI spec: http://127.0.0.1:8080/openapi.yaml
# Flowrensic health: http://127.0.0.1:8080/healthz
# Flowrensic readiness: http://127.0.0.1:8080/readyz
# Flowrensic Prometheus metrics: http://127.0.0.1:9464/metrics
# Grafana home: http://127.0.0.1:3000/
# Grafana judging dashboard: http://127.0.0.1:3000/d/flowrensic-judging/flowrensic-judging
# Grafana platform dashboard: http://127.0.0.1:3000/d/flowrensic-platform/flowrensic-platform
# Grafana sustainability dashboard: http://127.0.0.1:3000/d/flowrensic-sustainability/flowrensic-sustainability
# Grafana storage and ingest: http://127.0.0.1:3000/d/flowrensic-storage-and-ingest/flowrensic-storage-and-ingest
# Temporal UI: http://127.0.0.1:8233/
# Temporal gRPC: 127.0.0.1:7233
# Temporal Prometheus metrics: http://127.0.0.1:9233/metrics
# Prometheus itself is internal to this Compose network at http://prometheus:9090/;
# it has no host port published by default. FLOWRENSIC_PORT,
# FLOWRENSIC_METRICS_PORT, and FLOWRENSIC_GRAFANA_PORT change the host ports.
services:
standalone:
image: ${FLOWRENSIC_STANDALONE_IMAGE:-flowrensic/temporal-flowrensic-standalone:latest}
restart: unless-stopped
environment:
FLOWRENSIC_KNOWN_ENVS: '${FLOWRENSIC_KNOWN_ENVS:-[{"name":"local","kind":"persistent","accessKey":"${FLOWRENSIC_LOCAL_ENV_ACCESS_KEY:-local-access-key}","historyRequired":true,"address":"temporal:7233","metricsAddress":"temporal:9233","namespaces":[{"name":"default"}]}]}'
depends_on:
temporal:
condition: service_healthy
ports:
- "${FLOWRENSIC_PORT_BIND:-127.0.0.1}:${FLOWRENSIC_PORT:-8080}:8080"
- "${FLOWRENSIC_METRICS_BIND:-127.0.0.1}:${FLOWRENSIC_METRICS_PORT:-9464}:9464"
volumes:
- postgres-data:/var/lib/postgresql/data
- blobs:/var/lib/flowrensic/blobs
temporal:
image: temporalio/temporal:1.5.0
restart: unless-stopped
command:
- server
- start-dev
- --ip
- 0.0.0.0
- --ui-ip
- 0.0.0.0
- --metrics-port
- "9233"
ports:
- "${TEMPORAL_PORT_BIND:-127.0.0.1}:${TEMPORAL_PORT:-7233}:7233"
- "${TEMPORAL_UI_BIND:-127.0.0.1}:${TEMPORAL_UI_PORT:-8233}:8233"
- "${TEMPORAL_METRICS_BIND:-127.0.0.1}:${TEMPORAL_METRICS_PORT:-9233}:9233"
healthcheck:
test: ["CMD", "temporal", "operator", "cluster", "health", "--address", "127.0.0.1:7233"]
interval: 2s
timeout: 5s
retries: 15
demo-worker:
image: ${FLOWRENSIC_DEMO_WORKER_IMAGE:-flowrensic/temporal-flowrensic-demo-worker:latest}
restart: unless-stopped
depends_on:
temporal:
condition: service_healthy
standalone:
condition: service_healthy
environment:
TEMPORAL_ADDRESS: temporal:7233
TEMPORAL_NAMESPACE: default
TEMPORAL_TLS: "false"
TEMPORAL_TASK_QUEUE: flowrensic-demo
FLOWRENSIC_SERVER_BASE_URL: http://standalone:8080
FLOWRENSIC_CURRENT_ENV: local
FLOWRENSIC_ENV_ACCESS_KEY: ${FLOWRENSIC_LOCAL_ENV_ACCESS_KEY:-local-access-key}
START_EVERY_SECONDS: ${FLOWRENSIC_DEMO_START_EVERY_SECONDS:-10}
prometheus:
image: ${FLOWRENSIC_PROMETHEUS_IMAGE:-flowrensic/temporal-flowrensic-prometheus:latest}
restart: unless-stopped
depends_on:
- standalone
command:
- --config.file=/etc/prometheus/prometheus.yml
- --storage.tsdb.path=/prometheus
- --storage.tsdb.retention.time=15d
volumes:
- prometheus-data:/prometheus
grafana:
image: ${FLOWRENSIC_GRAFANA_IMAGE:-flowrensic/temporal-flowrensic-grafana:latest}
restart: unless-stopped
depends_on:
- prometheus
environment:
GF_AUTH_ANONYMOUS_ENABLED: "true"
GF_AUTH_ANONYMOUS_ORG_ROLE: Viewer
GF_AUTH_DISABLE_LOGIN_FORM: "true"
ports:
- "${FLOWRENSIC_GRAFANA_BIND:-127.0.0.1}:${FLOWRENSIC_GRAFANA_PORT:-3000}:3000"
volumes:
postgres-data:
blobs:
prometheus-data:Start the stack from that directory:
docker compose up -dThe first start downloads the images. When the containers are healthy, open:
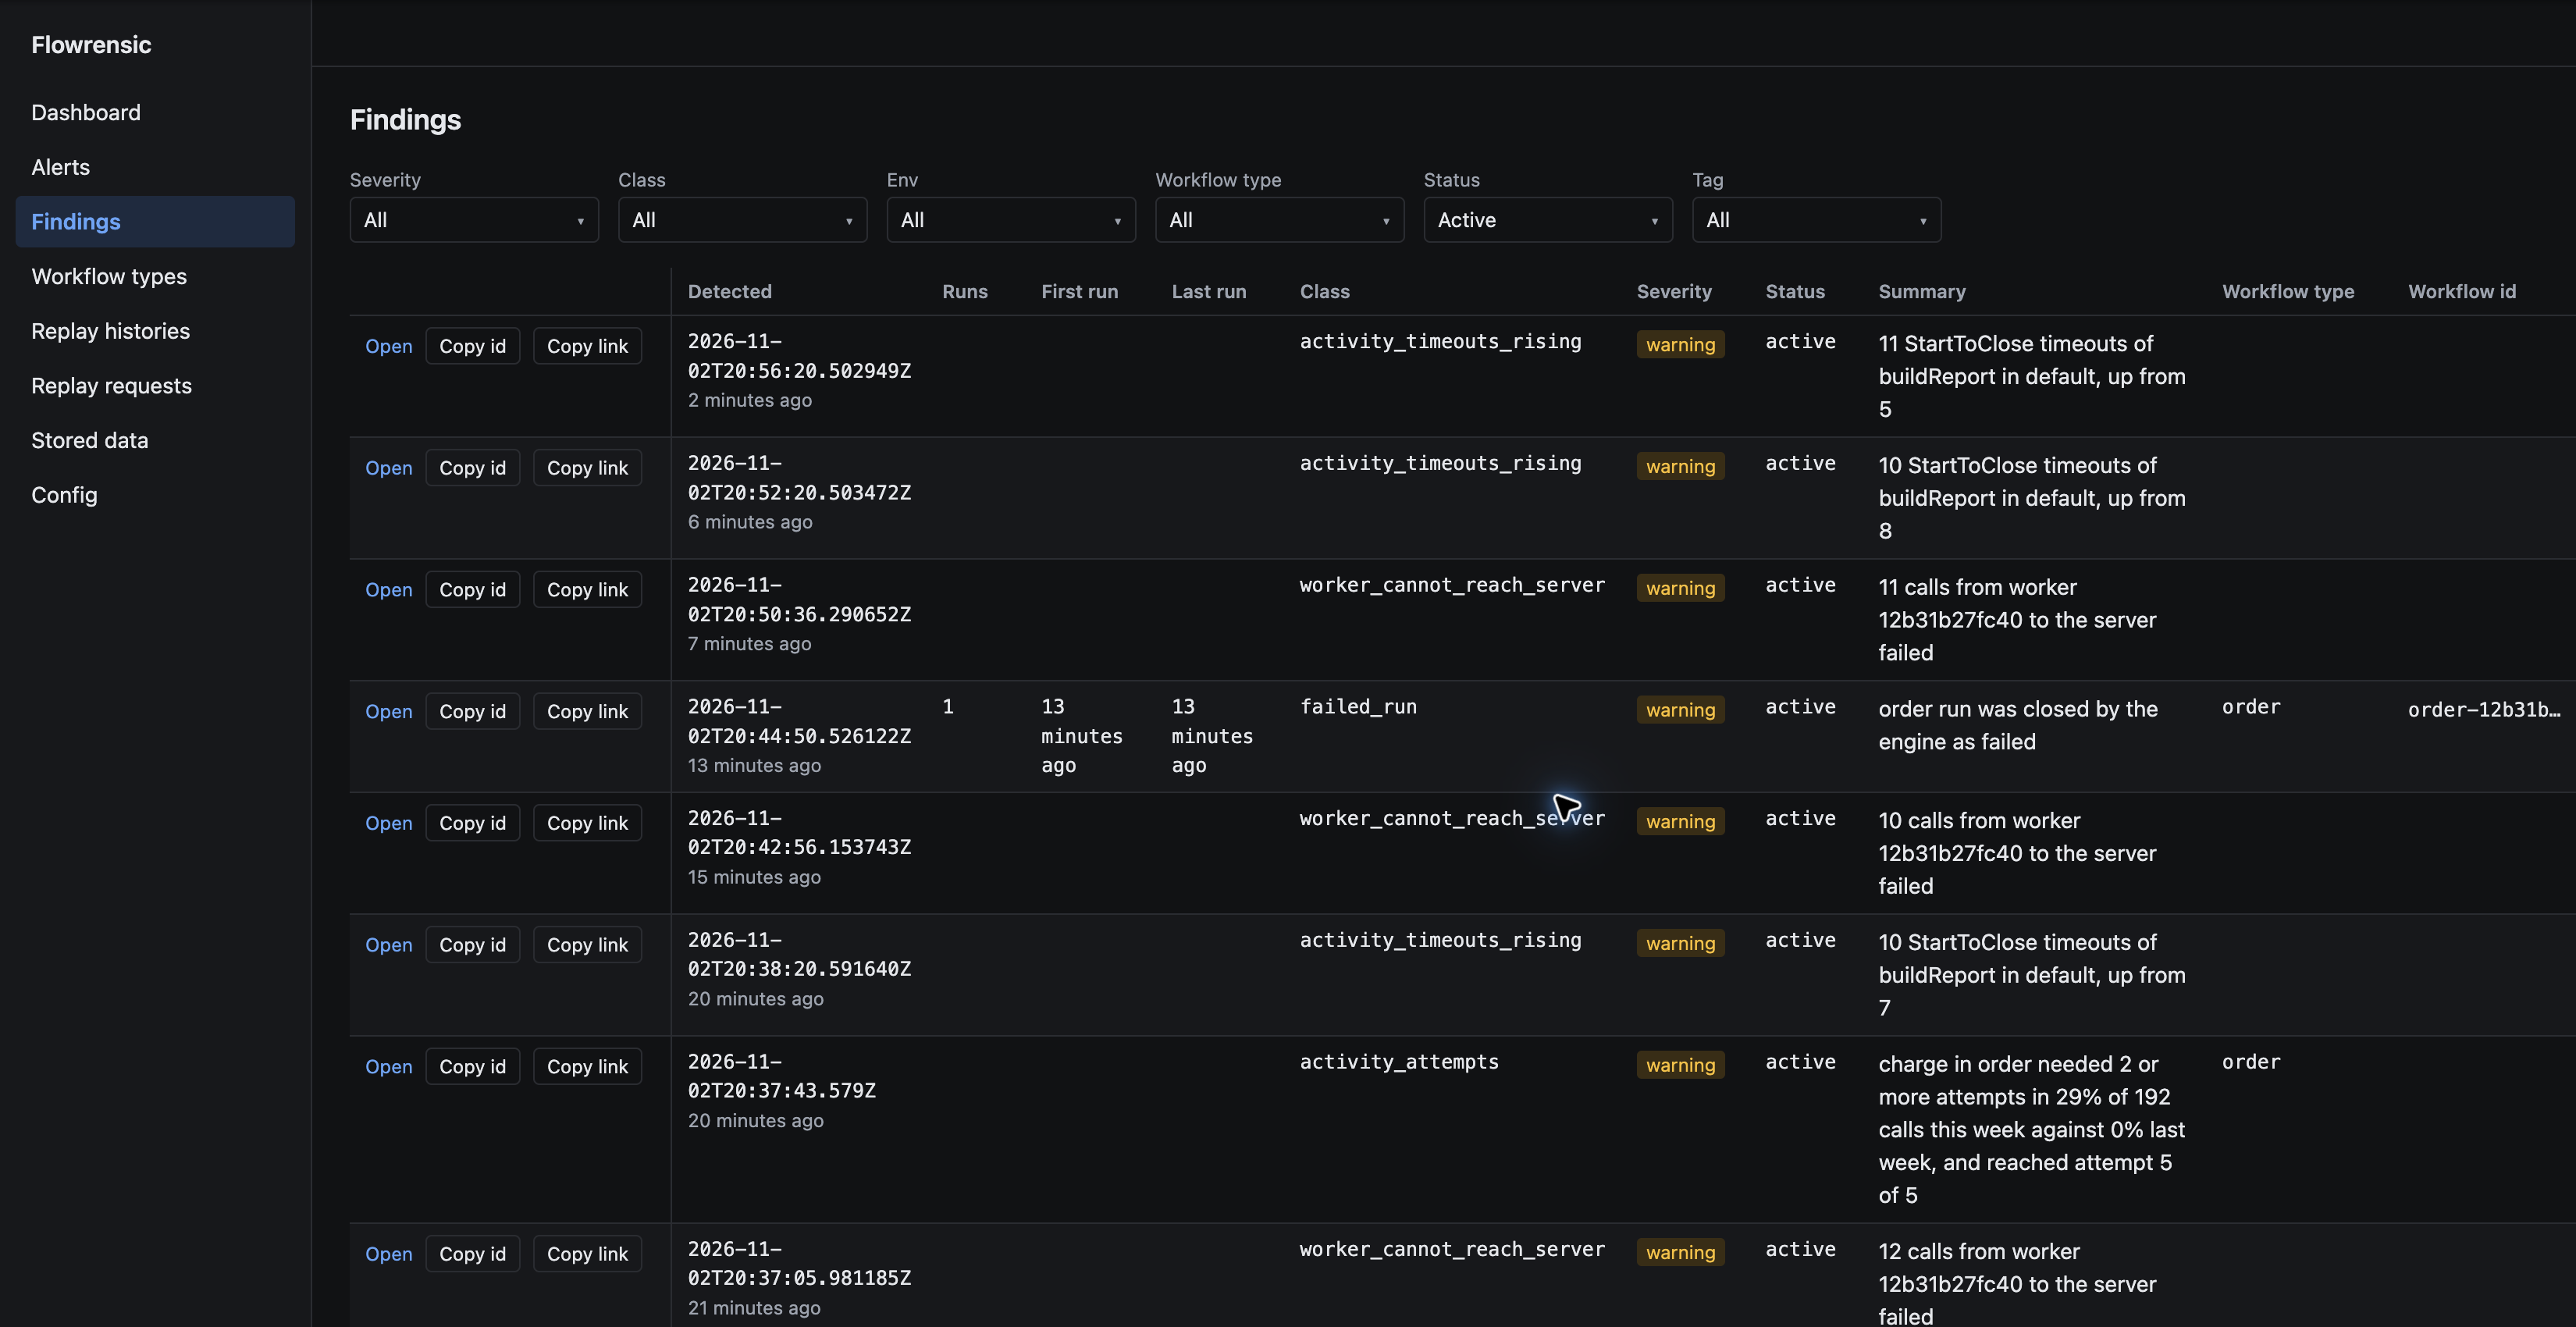
Flowrensic findings appear after the demo worker runs. Prometheus is included on the private Compose network and scrapes Flowrensic and Temporal metrics. The bundled Grafana is preconfigured with Flowrensic dashboards and opens without a login for local use.
To stop the stack, run docker compose down. To stop it and remove its persisted data, run docker compose down -v.
This Compose file is a local standalone demo. It starts its own Temporal server and demo worker. For an existing Temporal deployment, configure the standalone service to connect to that server and remove the demo worker service.
Add the Node SDK to a worker
Install the package in your Temporal worker project:
npm install @flowrensic/temporal-flowrensic-node-sdkThe standalone image registers a local environment and the default namespace. For a worker running on your host, use Flowrensic at http://127.0.0.1:8080 and the local environment key local-access-key (change it before exposing the service beyond your machine). The SDK reads the namespace of each attempt from Temporal, so there is nothing to look up first.
Create a sink once when your worker process starts, then attach the activity interceptor. workerName is the same for every copy of this worker; version can be your deployed code version.
import { Worker } from '@temporalio/worker';
import { createAttemptSink, flowrensicInterceptor } from '@flowrensic/temporal-flowrensic-node-sdk';

const sink = createAttemptSink({
  serverBaseUrl: process.env.FLOWRENSIC_URL ?? 'http://127.0.0.1:8080',
  currentEnv: 'local',
  envAccessKey: process.env.FLOWRENSIC_ENV_KEY ?? 'local-access-key',
  workerName: 'my-worker',
});

const worker = await Worker.create({
  // Keep your existing connection, namespace, taskQueue, and workflowsPath settings.
  connection,
  namespace: 'default',
  taskQueue: 'my-task-queue',
  workflowsPath,
  activities,
  interceptors: {
    activity: [flowrensicInterceptor(sink, { version: process.env.GIT_SHA })],
  },
});

try {
  await worker.run();
} finally {
  await sink.close();
}
The SDK records one event per activity attempt and sends it to Flowrensic in batches. Telemetry failures do not fail the activity. Install Temporal's Node SDK packages alongside @flowrensic/temporal-flowrensic-node-sdk; the SDK requires Temporal 1.24 or newer. SDKs for other languages are on Packages.
Screenshots
Browse the screens for each browser-accessible URL in the standalone Compose setup. Select a tab or use the arrow keys.